We believe in creating a more resilient future for the food manufacturing industry
We do this through systematic, adaptive and explainable AI.
Talk to usAI demand forecasting built around your planning team
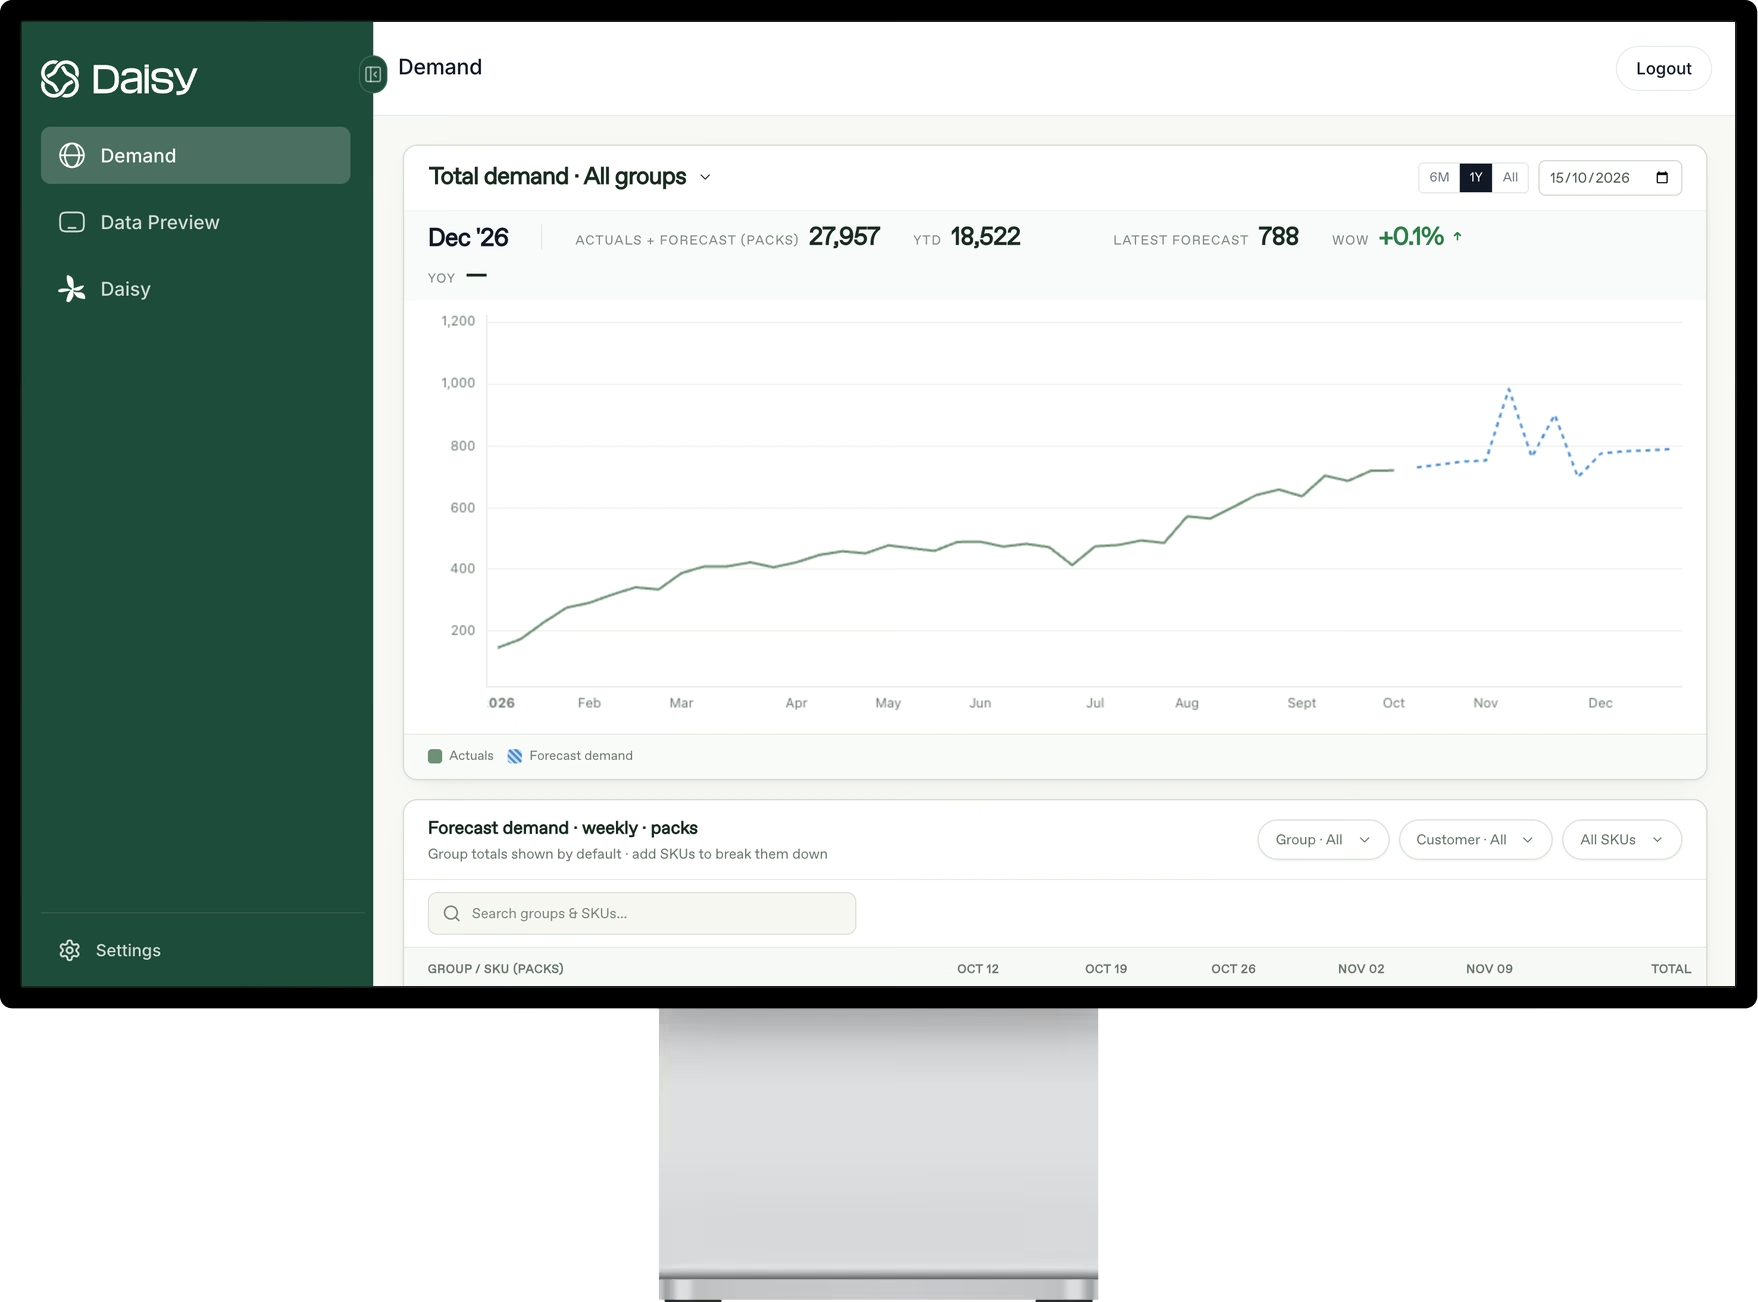
We deliver the demand and supply forecast you plan against, so you hold less working capital and protect your margin. Daisy combines thousands of external market variables with your team's real-time observations, creating account & SKU-level forecasts that planners trust to protect OTIF and minimize excess inventory.
We provide an intelligent planning and forecasting platform that reduces working capital and maximizes profitability
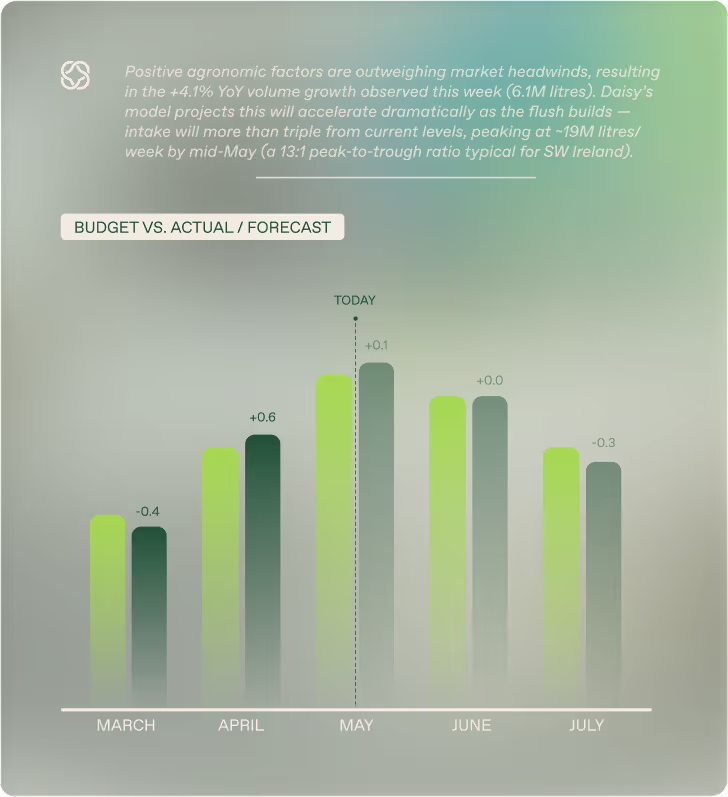
We predict sales at the SKU and account level. Reduce forecast errors and give your team the visibility they need to make confident decisions.
Set stock levels from the demand forecast, balancing service level against inventory and the working capital it ties up.
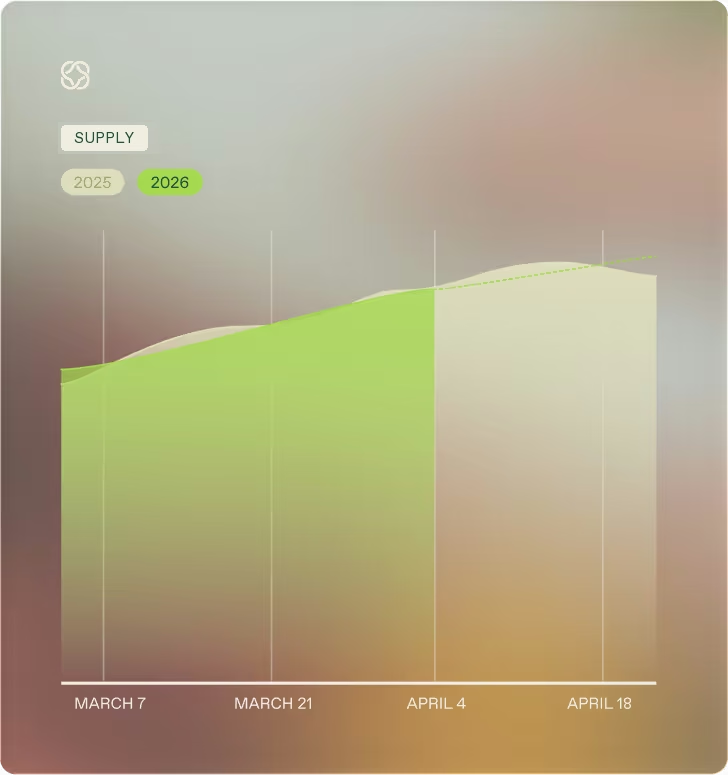
Anticipate how much supply you will receive and identify exact purchasing gaps based on real-time data.
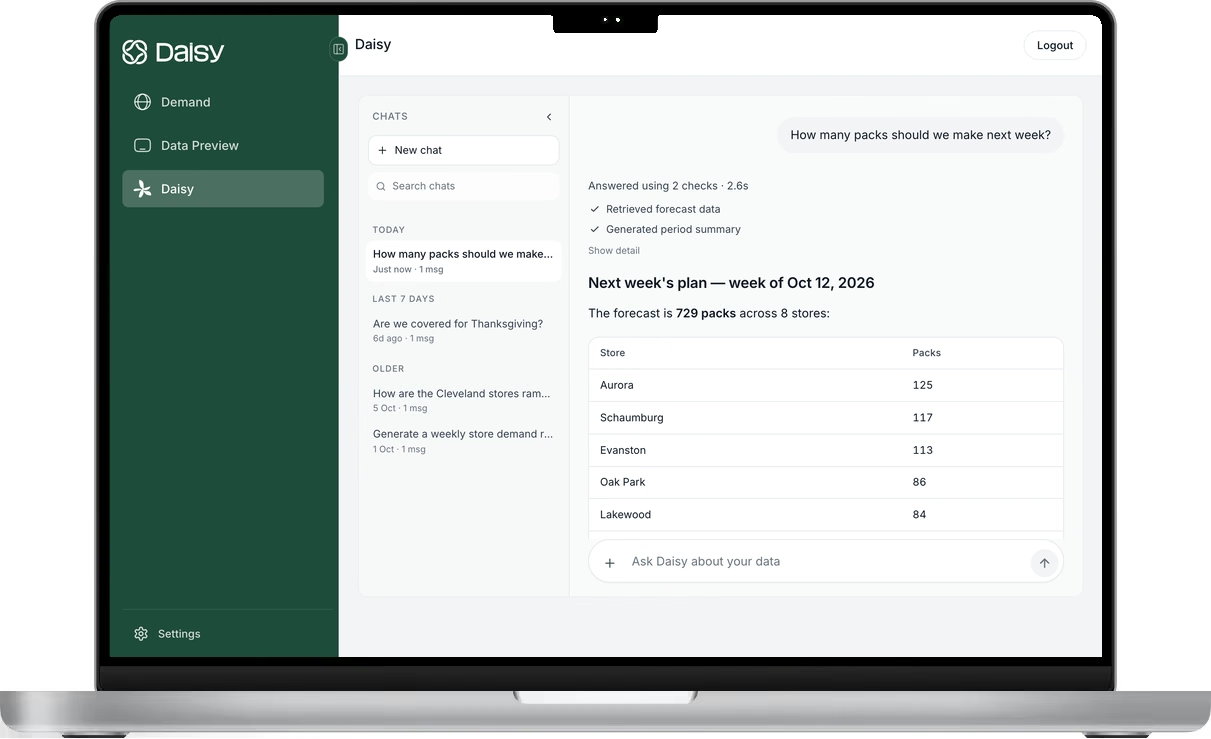
We compile the data, structure the breakdowns, and do the grunt work - so your team can execute regular processes flawlessly.
We predict sales at the SKU and account level. Reduce forecast errors and give your team the visibility they need to make confident decisions.

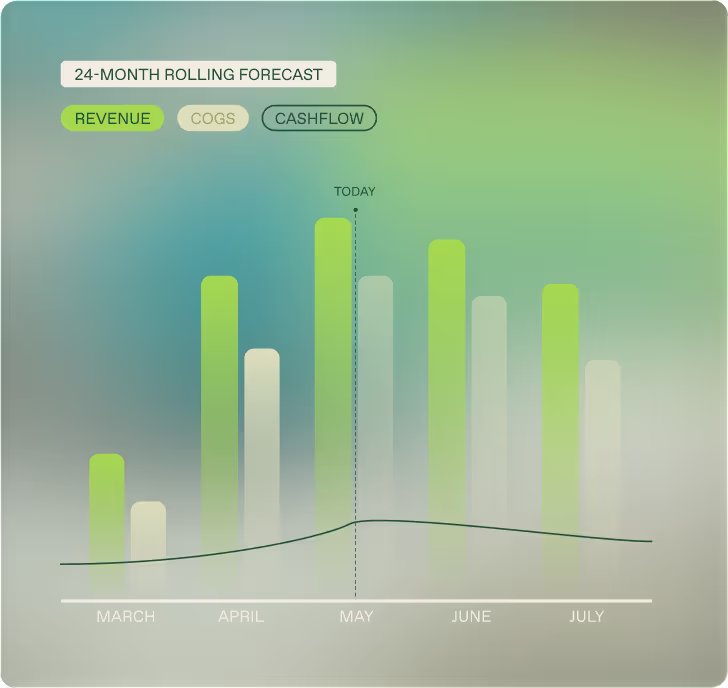
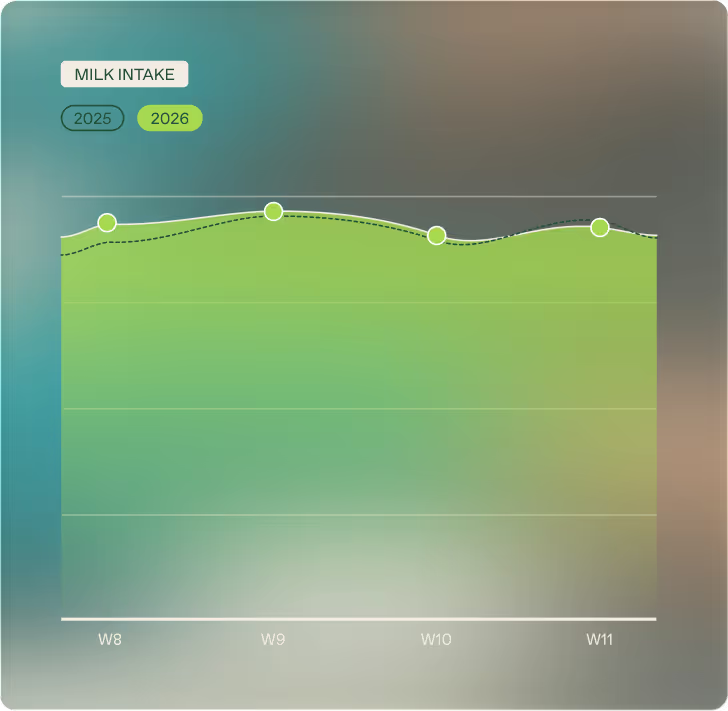
Set stock levels from the demand forecast, balancing service level against inventory and the working capital it ties up.

Anticipate how much supply you will receive and identify exact purchasing gaps based on real-time data.

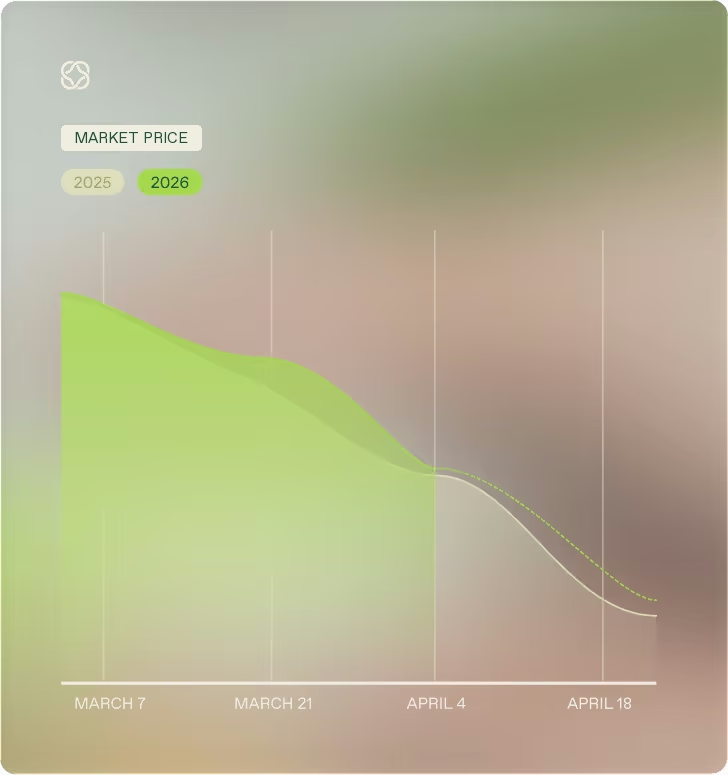
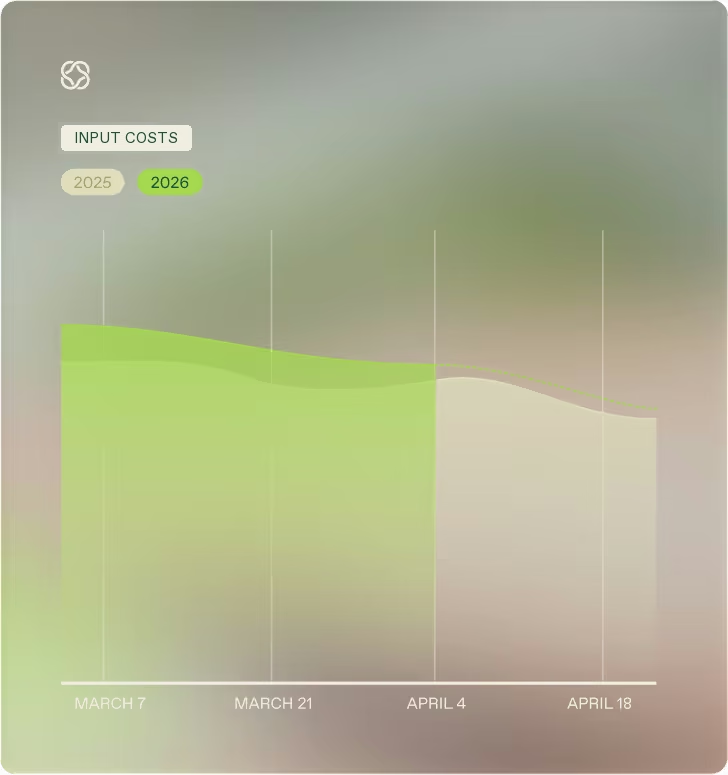
We compile the data, structure the breakdowns, and do the grunt work - so your team can execute regular processes flawlessly.

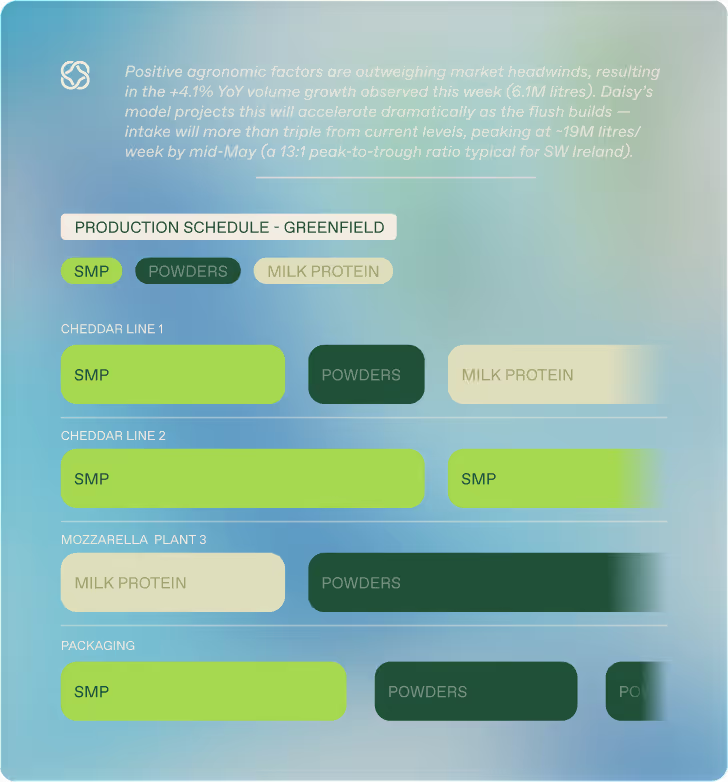
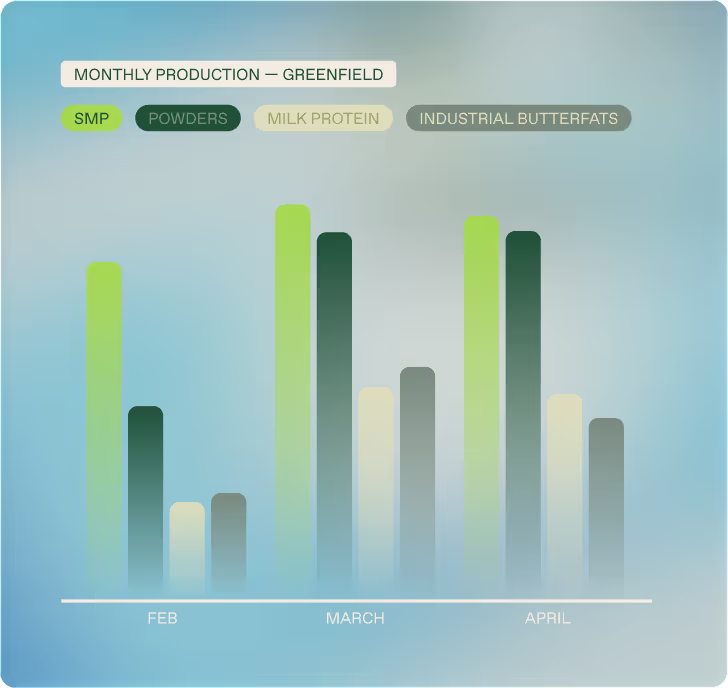
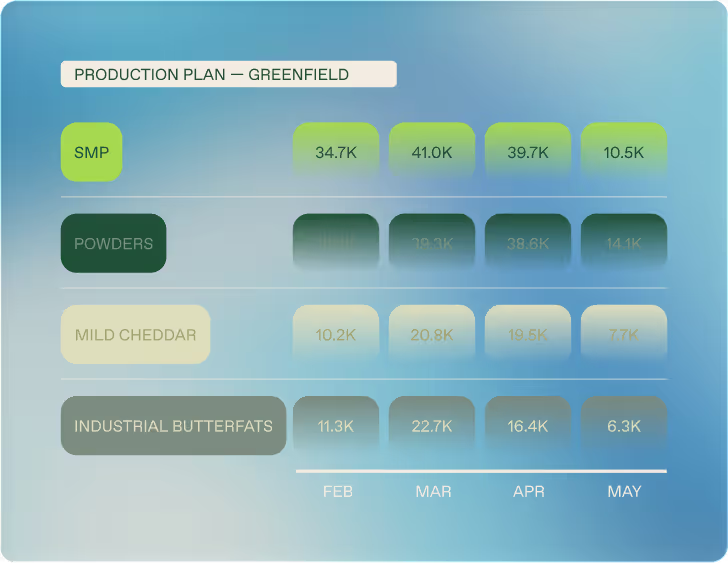

Two ways to fix a forecast
Old world
- Forecasting on intuition and spreadsheets
- Intelligence lives in a few people’s heads
- Marginal gains wiped out by volatility nobody modeled
- Takes enormous work to find data and prepare forecasts
New World
- Real-time intelligence that is fully maintained
- Friction-less proof that feels seamless as opposed to legacy players
- Everything in one place
- Still require human intuition to interact with the models
See Daisy in action.
Start with a 12-week pilot, run alongside your forecast
Want to try Daisy ?
We’ll be in touch shortly to set up a time.
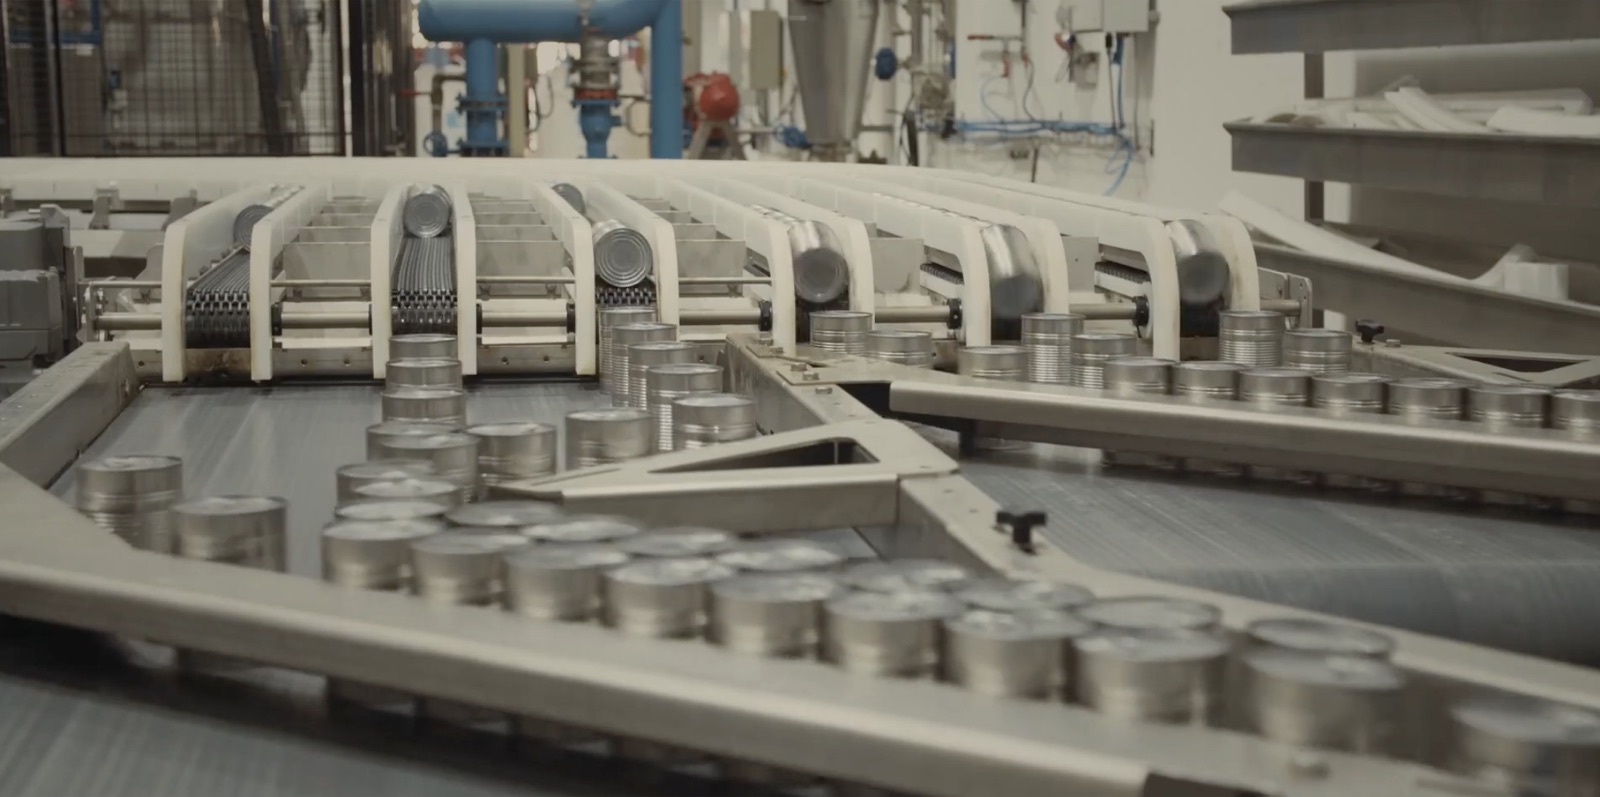
Build tools
for the real world.
Daisy started on a fourth-generation Irish dairy farm.
This shapes our team and how we think. We understand the struggles that the industry faces and are building for an industry that actually needs us.
If you want to solve hard problems with real-world stakes, this is the place.